Some people are in the habit of checking their phone or email every minute or two.
Similarly, I have colleagues, friends and family who check their slow-moving investments - like their 401ks - on a near-daily basis.
I do this too, and although I trade several times a week at minimum, I suspect I might be checking the long-term stuff too often as well.
Checking the performance of long-term investments too often can harm your mental state, as well as induce you to make bad decisions when things get ugly. Even professional investors struggle to deal with this1.
Conversely, my girlfriend could be the worlds most sanguine investor, as she rarely checks her investment performance other than when she’s actually doing something with her portfolio.
But surely being constantly up to date on your investment performance can only be a good thing, right?
Well..it’s not always that simple…
Loss Aversion
Humans exhibit a behavioral trait called Loss Aversion2.
In English, this means that people in general have stronger feelings of anguish resulting from a loss than happiness resulting from a win.
Take for example a coin toss game where you win $10 if you guess the side of the coin correctly, but lose $10 if you guess incorrectly.
Loss Aversion implies that you’ll feel more emotional pain from losing $10 than the comparative joy you’d feel from winning $10.
In fact, Loss Aversion implies that for you to have the same intensity of feelings between the two outcomes, you might have to win much more (e.g. $20), for every loss (e.g. $10) for you to be indifferent.
This lop-sided impact arising from Loss Aversion can discourage you from holding investments for the long run, even if the odds are in your favor.
Your Pension, or Retirement Account
Take retirement savings accounts for example - think of a company pension plan or a 401k.
They’re designed to be long-term investments.
The returns from long-term investments are often based on “risk premiums”.
Risk premiums reliably compensate investors over long time horizons.
Like every investment, however, they fluctuate in value and encounter periods of underperformance.
To add more complexity, the “shape” of positive investment performance usually looks different from the “shape” of negative investment performance.
Most commonly, the daily returns in the types of investments in pension plans are often negatively skewed.
Using very simple figures, this means that - for example…
- on 51% of days, you’ll win $10
- on 48% of days, you’ll lose $10.10
- on 1% of days, you’ll lose $20
Over a long timeframe, this averages out to
- on days you win, you’ll make $5.10
- on days you lose, you’ll lose approximately $5.05
You have “winning” days 51% of the time, and “losing” days 49% of the time
So over the long-term, you’ll average out to make about $0.05 per day.
But if you check your damn pension every day, you’re not going to experience this “long timeframe” behavior of earning $0.05 per day.
You’re going to experience the lop-sided negative skewed behavior of risk-premium-based assets.
As we learned earlier - when you observe “losing” days, they are going to impact you more than your “winning” days.
And what’s worse, is that given the negative skew of your investment, the “losing” days are going to feel a lot worse to observe3.
A stylistic example…
If we define your loss aversion level as something like 10% - where you feel the pain of a loss 10% more than the same gain - it will feel like this…
- on days you win, you’ll make $5.10
- on days you lose, you’ll lose $5.05, but it’ll feel like you’ve lost $5.55 ($5.05 + 10%)
So when factoring in loss aversion, if you observe each of these daily losses individually (checking your account daily), it will be difficult to rationalize that you’re making money over the long term, even if the figures speak for themselves objectively.
This is especially true when you have a sell-off in risk assets and you experience day after day of losses.
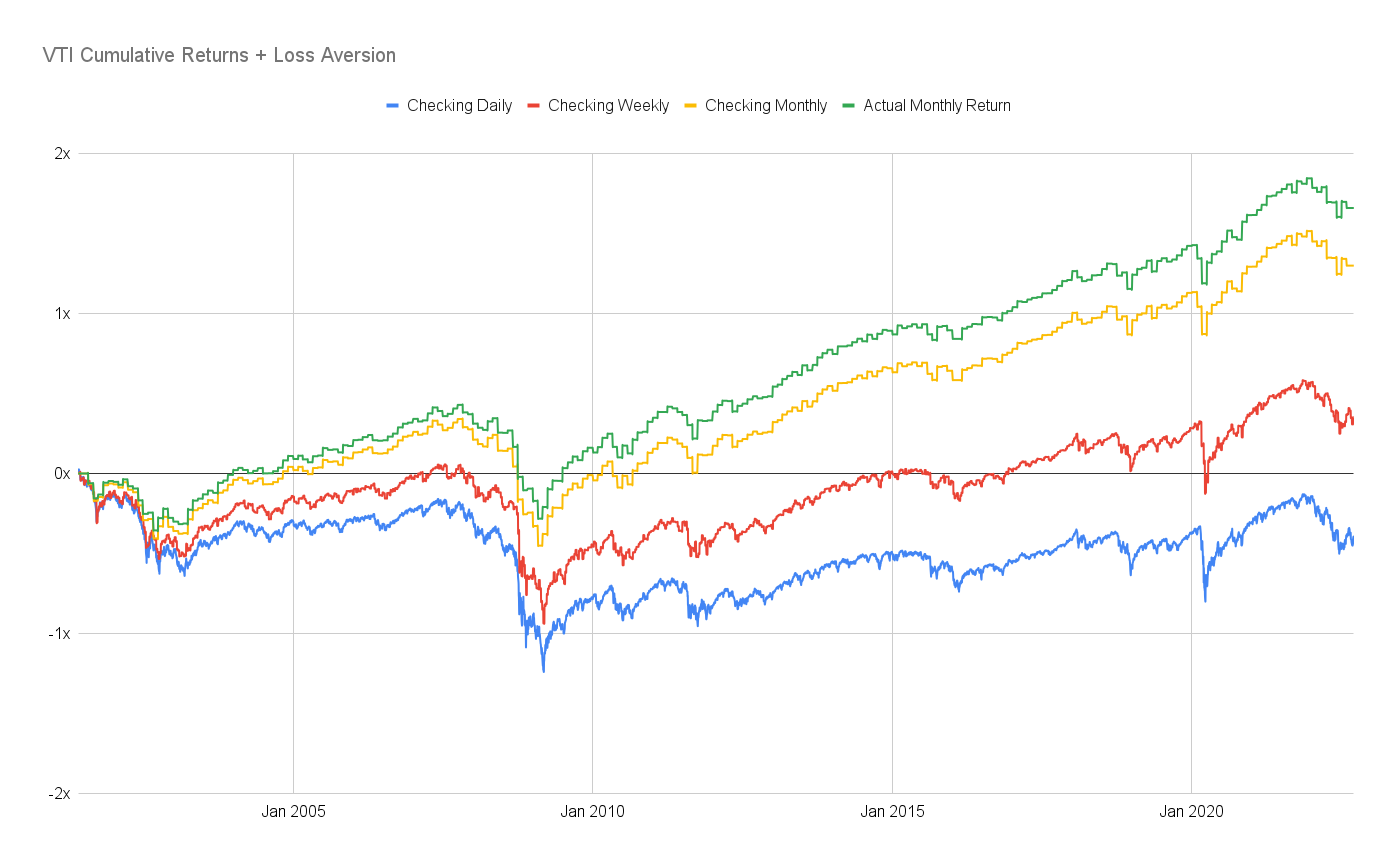
Here’s what it “feels” like to own Vanguard’s Total Stock Market ETF (VTI) over a long period of time, with this conceptual loss aversion of 10%, whether you check its performance daily, weekly, or monthly.

This is a diversified basket of equities; among the broadest and most diversified there is.
In terms of earning the Equity Risk Premium, there aren’t many better options than this.
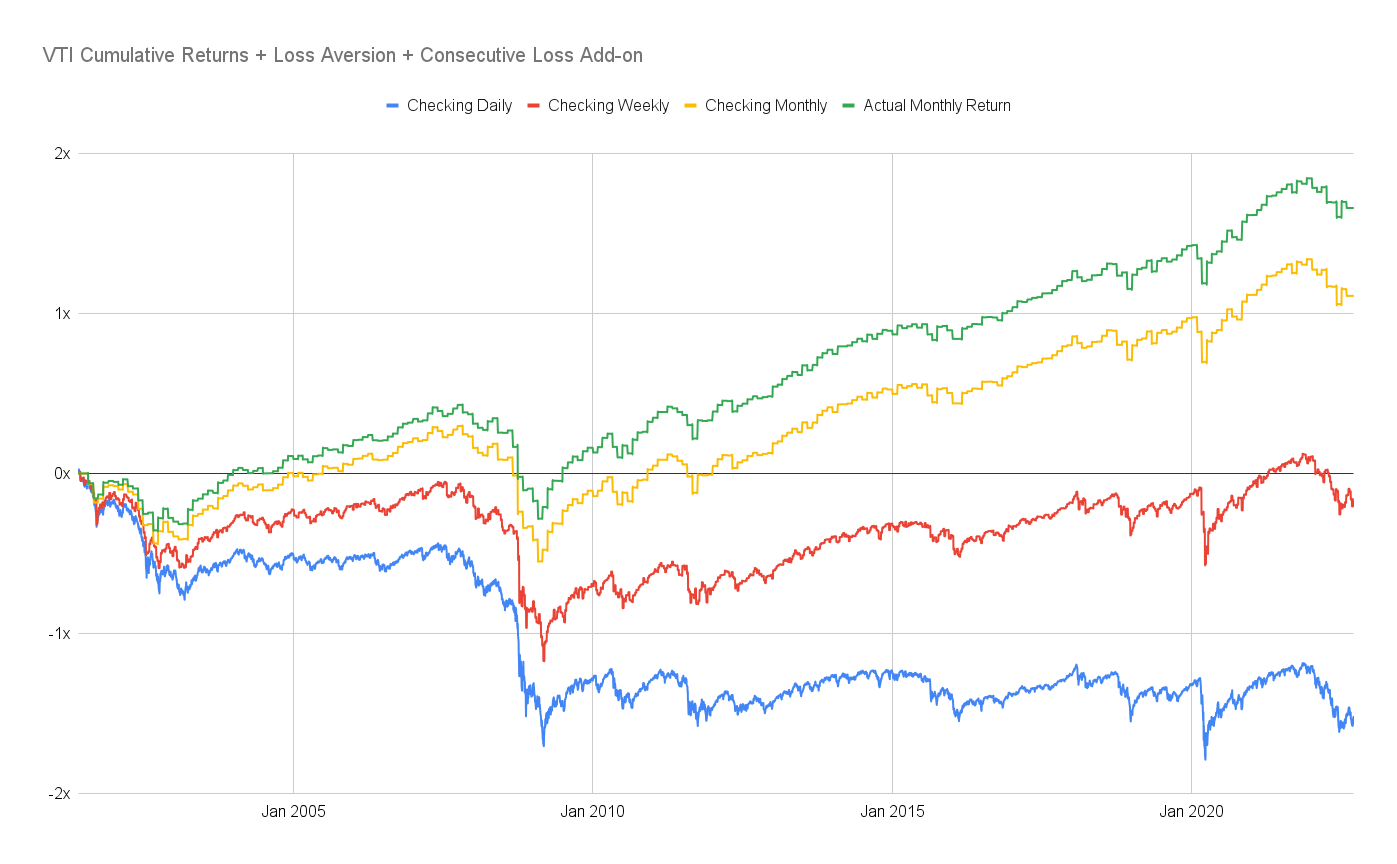
But even worse, you’re going to feel even more pain if you experience consecutive strings of losses one after another, which have been shown to compound each other.
Let’s say that when you have a second loss in a row, your loss aversion increases to 1.21…

So even with one of the most reliable risk premiums on the planet, and with the most broadly diversified and cheapest way to access it, over a long period of time, using this naively simple Loss Aversion model, the only palatable frequency on which you should observe your results is monthly - daily and weekly feel like you’re losing money.
So what can I do?
First of all, as long as you feel your risk is managed and that you have your ideal asset allocations - try to let your portfolio do its thing by leaving it alone.
If you rebalance your portfolio on a quarterly basis, and if you’re confident in the approach you’re using; perhaps try to only look at it at those quarterly rebalance events, and not in between.
There will of course be exceptions to the rule, and you should by no means neglect your finances, but try to slow things down if you can.
Go do something else - go outside, or think about how you can save more money, even!
That’s surely time better spend than looking at a number go up or down each day.
-
Haigh, Michael S., and John A. List. “Do Professional Traders Exhibit Myopic Loss Aversion? An Experimental Analysis.” The Journal of Finance 60, no. 1 (2005): 523–34. http://www.jstor.org/stable/3694846. ↩
-
Kahneman, Daniel, and Amos Tversky. “Prospect Theory: An Analysis of Decision under Risk.” Econometrica 47, no. 2 (1979): 263–91. https://doi.org/10.2307/1914185. ↩
-
Elkind, Daniel, Kathryn Kaminski, Andrew W. Lo, Kien Wei Siah, and Chi Heem Wong. “When Do Investors Freak Out? Machine Learning Predictions of Panic Selling.” Journal of Financial Data Science 4(1), 11–39. ↩